Create two Charts from one Pivot table - add multiple excel charts
How can I create multiple Pivot Charts from one Pivot table in Excel ?
Hi,
To create multiple pivot charts from one pivot table, you have to click on your pivot table:
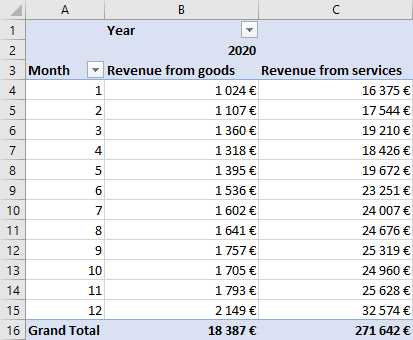
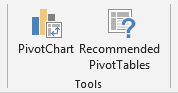
Go to Analyze section in Pivot Table Tools:

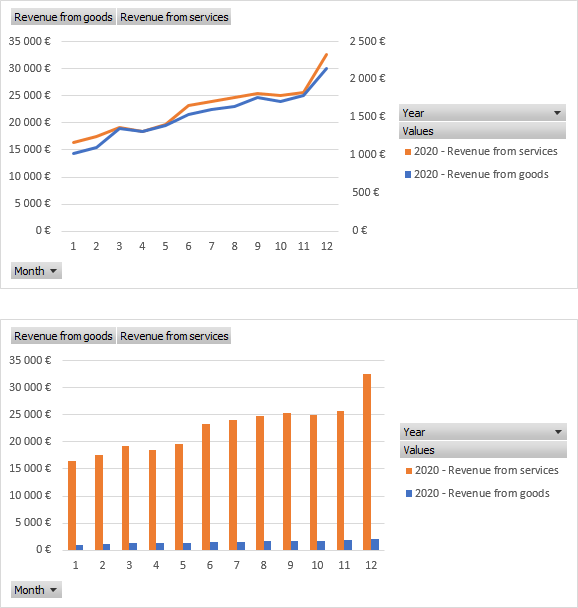
Click on Pivot Chart and choose the Chart Type:
To add another pivot chart from the same pivot table, you have to repeat the chart creation process again and choose a different type of chart. You can also add multiple pivot charts by copy and paste functions, using Ctrl+C and Ctrl+V. Then you can click on the new chart with right mouse button and choose adifferent formatting.
To create multiple pivot charts from one pivot table, you have to click on your pivot table:
Go to Analyze section in Pivot Table Tools:
Click on Pivot Chart and choose the Chart Type:
To add another pivot chart from the same pivot table, you have to repeat the chart creation process again and choose a different type of chart. You can also add multiple pivot charts by copy and paste functions, using Ctrl+C and Ctrl+V. Then you can click on the new chart with right mouse button and choose adifferent formatting.
1 answer
Related questions
How to add side by side rows in excel pivot table ?
Is CSV excel file Comma or Semicolon separated / delimited ?
Check if value exists in column more than once or twice - Excel
Different background color for Odd / Even table rows - CSS
How to show Euro, Dollar or Pound sign on right in Excel ?
Zero value not showing on Excel chart vertical axis - how to display ?
Move excel chart horizontal axis to bottom - below negative values
Excel and Word menu tabs & tools in toolbars disabled / grayed out
Copy and update rows in the same table with autoincrement - SQL
Invalid cell reference error in Excel vLookup function - #REF!
Trending questions
Is PLS LCD display good ? Difference between PLS LCD and Amoled Man Month calculation - how many man days or man hours ? 5000 mAh battery charging time with 15W, 25W, 45W charger How to add side by side rows in excel pivot table ? Remove or hide bottom navigation bar with buttons on Android How to change QWERTZ keyboard to QWERTY in Windows 10 ? Instagram error on upload: VideoSourceBitrateCheckException Samsung Galaxy A & F better than M series ? What's the difference ? How to calculate inverse currency exchange rate ? ATM withdrawal With or Without conversion - Accept or Decline ?
Is PLS LCD display good ? Difference between PLS LCD and Amoled Man Month calculation - how many man days or man hours ? 5000 mAh battery charging time with 15W, 25W, 45W charger How to add side by side rows in excel pivot table ? Remove or hide bottom navigation bar with buttons on Android How to change QWERTZ keyboard to QWERTY in Windows 10 ? Instagram error on upload: VideoSourceBitrateCheckException Samsung Galaxy A & F better than M series ? What's the difference ? How to calculate inverse currency exchange rate ? ATM withdrawal With or Without conversion - Accept or Decline ?
2025 AnswerTabsTermsContact us